Overview
One of the questions commonly raised is and we quote: “Why does my catheter NOT achieve the predicted burst pressure and/or kink radius predicted values as modeled by the CathCAD® software?” And the answer to the question typically has to do with the actual (physical) build of the composite tubing. To better explain this answer we provide the following example.
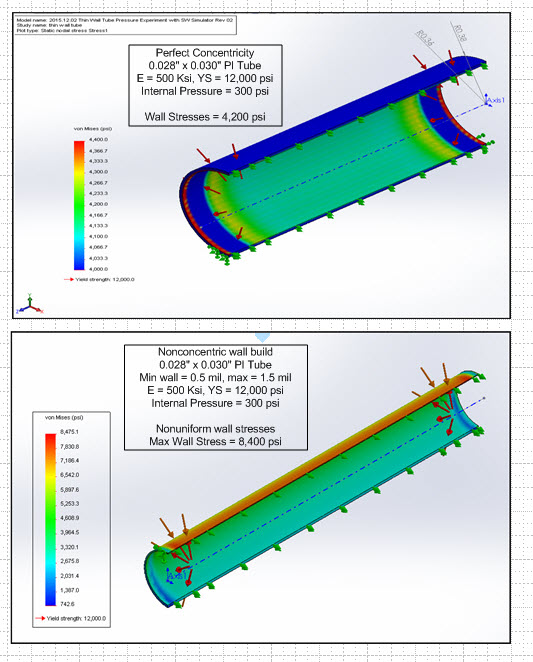
A simple tube was constructed and modeled in SolidWorks 2012 and was subjected to an inner pressure of 300 psig. The inner diameter of the tube was 0.028 inches and the outer diameter was 0.030 inches. The chosen material of the design was Polyimide and the typical material properties for this design were assigned. In the first design — the wall concentricity was perfectly uniform (1 mil wall). In the second design — the wall was made nonuniform (min wall = 0.5 mil, max wall = 1.5 mil).
The results of the FEM are provided in the figure provided. In the first case, the wall stresses are uniform and the model shows that the wall stresses are approximately 4,200 psi which agrees well with hand computations. In the second case, the wall stress are nonuniform and the peak wall stress is approximately 8,400 psi (the top edge of the design) or double the wall stress of the first case. As a result, the nonuniform tube design would have only 50 percent of the rated pressure capability of the first (uniform) design. A similar result would be realized with the kink radius result for these two designs.
It is common in the industry for the manufacturer’s of thin wall tube to describe their wall tolerance control as being +/- 25 percent. In actuality, their results may actually be WORSE as they only sample a few tubes in a lot and as long as the wall measurements fall within the min/max wall limits the lot is considered GOOD. A more appropriate control method is to apply a statistical measurement process to the wall measurements and the expected min/max wall limits can be inferred from a statistical sampling of the lot.
Services
